RMS 6th grade Math scholars will complete a project on Unit 6-Statistics and Probability. Each student was given a set of numerical data to use for their project. The numerical data will be displayed in plots on a number line, including a dot plot, histogram and box and whisker plot. Students must also create a statistical question for their data.
Dot Plot
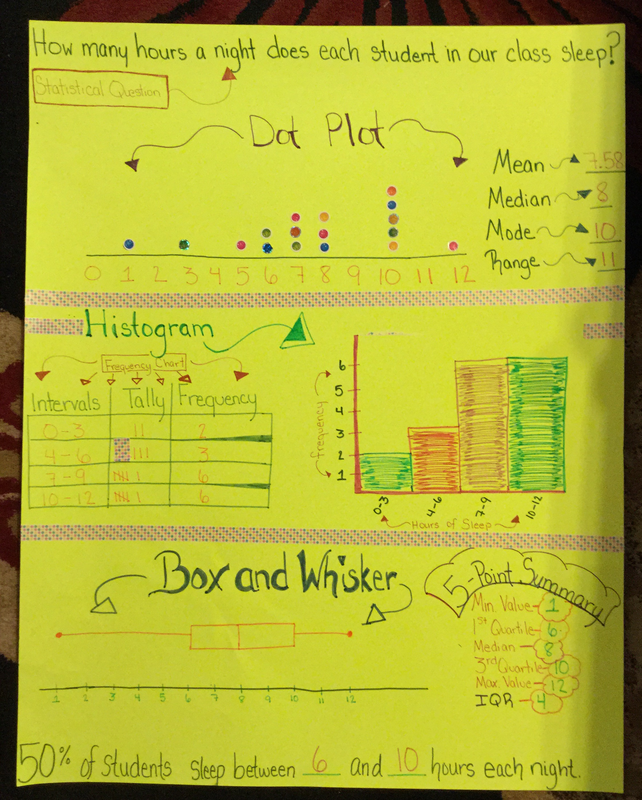
Students will display their data using a dot plot. Students must also find and list the mean, median, mode and range of their data.
Histogram
Students will display their data using a histogram. Students must also create a frequency chart listing the intervals, tallies, and frequencies of their data.
Box and Whisker Plot
Students will display their data using a Box and Whisker plot. Students will also find and list the 5-Point Summary (Minimum Value, 1st Quartile, Median, 3rd Quartile and Maximum Value) for their data. Students must also find the inter-quartile range (IQR) for their data.
A copy of the rubric was given to each student on Thursday, March 26, 2015. The project is due Thursday, April 2, 2015. Materials needed for the project are: 1 Large Poster Board, Small Circular Stickers (for the dot plot) and Colorful Markers (for the histogram, etc.).
Attached is a copy of the rubric and an example of a set of data I used to create a dot plot, histogram and box and whisker plot on a large poster board. The set of data I used was: 1, 3, 5, 6, 6, 7, 7, 7, 8, 8, 8, 10, 10, 10, 10, 10 and 12.
Happy Learning!!
-Ms. Farmer
Dot Plot
Students will display their data using a dot plot. Students must also find and list the mean, median, mode and range of their data.
Histogram
Students will display their data using a histogram. Students must also create a frequency chart listing the intervals, tallies, and frequencies of their data.
Box and Whisker Plot
Students will display their data using a Box and Whisker plot. Students will also find and list the 5-Point Summary (Minimum Value, 1st Quartile, Median, 3rd Quartile and Maximum Value) for their data. Students must also find the inter-quartile range (IQR) for their data.
A copy of the rubric was given to each student on Thursday, March 26, 2015. The project is due Thursday, April 2, 2015. Materials needed for the project are: 1 Large Poster Board, Small Circular Stickers (for the dot plot) and Colorful Markers (for the histogram, etc.).
Attached is a copy of the rubric and an example of a set of data I used to create a dot plot, histogram and box and whisker plot on a large poster board. The set of data I used was: 1, 3, 5, 6, 6, 7, 7, 7, 8, 8, 8, 10, 10, 10, 10, 10 and 12.
Happy Learning!!
-Ms. Farmer
 RSS Feed
